Plenary07: Avian demography: Statistics and ornithology
L.G. Underhill
Avian Demography Unit, Department of Statistical Sciences, University of Cape Town, Rondebosch, 7701, South Africa, e-mail
LGU@maths.uct.ac.zaUnderhill, L.G. 1999. Avian demography: Statistics and ornithology. In: Adams, N.J. & Slotow, R.H. (eds) Proc. 22 Int. Ornithol. Congr., Durban. Ostrich 70 (1): 61–70.
Avian demography is defined here as the study of the statistics of bird populations. Ornithology has generated types of data – or been the first discipline to generate them – which do not lend themselves to standard statistical analyses. In these situations, the role of the avian demographer is to develop custom-built statistical methods – the analysis of primary moult is an example of a type of data needing specialised methods and this is discussed in the final sections of the paper. Data from the Southern African Bird Atlas Project is used to present some insights into the biogeography of southern African birds, and to describe the ‘texture’ of bird distributions. The year 1998 marks, approximately, the centenary of the introduction of the European Starling Sturnus vulgaris to Cape Town and the House Sparrow Passer domesticus to Durban, and the paper notes this event and these species.
STATISTICS, THE SERVICE DISCIPLINE
Statistics is a service discipline, making a decisive contribution to all disciplines, including ornithology. It is probably unique in being the only scientific discipline dedicated to the service of other disciplines. Statistics does not exist in its own right in the way that Biology, Chemistry, Physics or even Mathematics do. If there were no scientists in these disciplines developing theories, performing experiments, making observations, collecting data, there would be no need for Statistics. The best statistical research is that which is motivated by real problems arising from data in other disciplines. In ornithology, examples include analysis of survival probabilities from bird ringing studies (e.g. Lebreton et al. 1992), the analysis of moult (Underhill & Zucchini 1988) and the correlation problem for which Summers & Underhill (1991) used a ‘brute force’ randomization approach that was subsequently solved analytically by Brandão (1998).
The interaction between the statistician and the specialist from a discipline is potentially a two-way trade. There should be benefits in both directions. The worst form of one-way trade is when the discipline specialist merely expects the statistician to deliver P-values, preferably less than 0.05. At a better level, the discipline specialist obtains from the statistician a deeper insight into his or her data, and feels a real sense of confidence in their interpretation. At best, statistician and discipline specialist work together as a team; the interaction has benefits to both when the data analytic problems arising out of the consultation motivate the development of new statistical theory. If this plenary were being addressed at a statistical audience, I would be complaining that a lot of what passes as statistical theory and fills the statistical journals is actually Mathematics; my conviction is that unless there are applications it is not really Statistics. In 1973, 25 years ago, I graduated with a doctorate, allegedly in Statistics (Underhill 1973). I solved a problem but, in the intervening 25 years, no one has had that problem. My PhD was really Mathematics, not Statistics.
Demography is the study of all aspects of the conditions of life in communities; avian demography therefore of bird communities. In human communities the demographer discusses topics such as the size and age structure of the population, births, deaths, immigration and emigration, prevalence of disease and other processes operating in the community, income and expenditure, and aspects such as commuting, transport and morphometrics. The avian demographer covers the analogues of all these topics in bird populations (Underhill et al. 1991).
Ornithology has generated new types of data – or been the first discipline to generate them – which do not lend themselves to standard statistical analyses. In these situations, the role of the avian demographer is to develop and apply custom-built statistical methods.
BIOLOGICAL MEANINGFULNESS VERSUS STATISTICAL SIGNIFICANCE
As sample sizes increase, even small differences in the parameters being tested become ‘statistically significant’ at, say, the 5% level, P<0.05 . A hypothetical example involving a simple t-test is shown in Box 1. With a sample of size 10, the null hypothesis of no change in mean is accepted; but with a sample of size 50, it is rejected. The first author would report: ‘There was no difference in wing-length (t9 = 1.26 , P>0.05).’ The second would write: ‘There was a significant difference in wing-length (t49 = 2.83 , P<0.005).’ Although the difference between the value of the mean specified in the null hypothesis and the observed mean is identical in both cases, the opposite conclusions are drawn. The only barrier between the researcher and statistical significance is sample size. If sample sizes are large enough, even trivial differences become significant. Ten years ago the ‘Instructions to Authors’ of Ibis implied that if a result was not statistically significant at the 5% level, it was not publishable. That is fine, but researchers are sometimes tempted to believe the converse of this statement: ‘If my result is statistically significant at P<0.05 , then I have something I can publish.’
For many scientists, the role of the statistician has been reduced to supplying P’s smaller than 0.05. At a banal level of analysis, the client comes to the statistician with the impolite request: ‘Will you please P my data?’ This approach to statistics is becoming known among statisticians as the P-value culture (a term due to J.A. Nelder, see Nelder (1999)). The following example (one of many, and therefore quoted anonymously) is taken from the literature: ‘Grey Plovers Pluvialis squatarola captured in 1993 have significantly longer bills than birds captured in Mauritania (t186 = 2.956 , P<0.01) . . . Grey Plovers wintering in the Mediterranean have on average longer wings and bills (respectively t288 = 4.139 , P<0.001, and t257 = 2.085, P<0.05).’ We are told that the differences were significant, but we are not told (even in a table) how large the differences actually were. In the third of the t-tests above, a knowledge of the standard deviation of Grey Plover bill lengths (1.5 mm) suggests that the actual difference was 0.4 mm, a relative difference of 1.5% in a 30 mm bill. A difference of this magnitude might be attributable to inter-observer differences in bill-measuring technique. Even if this difference is genuine, its biological meaningfulness needs to be assessed. Application of Normal distribution theory shows that if two Grey Plovers from Mauritania and the Mediterranean were to meet at random to compete for food, the probability is 0.43 that the bird with the longer bill would come from the Mauritanian population, which on average has bills 0.4 mm shorter.
The moral is that results need to be both statistically significant and biologically meaningful. It is the role of the biologist to decide on what constitutes biological meaningfulness. For example, a survival probability might change from 0.47 to 0.48 between two years; the sample sizes might be large enough that mark-recapture methods (e.g. Lebreton et al. 1992) evaluate these differences to be statistically significantly. Does a change this small in survival probability have a biological meaning? Biologists are free to state that non-interesting changes, even though they are statistically significant, will be dismissed (as was done for example by Summers et al. 1992). Conversely, the reasons why statistically significant results are biologically meaningful should be discussed. The biological implications of statistically significant results need to be spelt out. It is not sufficient merely to be significant. Do not let grey matter be overruled by P-values calculated by the grey box.
There is another way in which the current insistence on P<0.05 is distorting science. The following is a caricature, but it does contain elements of truth. Suppose that someone sets up a plausible hypothesis, does the appropriate experiment, gathers the data, and finds that the null hypothesis of no effect gets rejected, P<0.05 . The result is published and enters the literature. Nineteen other scientists, scattered over the continents, repeat the experiment and each of them obtains a non-significant result. By the current conventions, none of these 19 scientists are easily able to publish their results, and they remain ignorant of each other’s findings. No one realizes that an experiment has been repeated 20 times, and a significant result has been obtained one time in 20 when the null hypothesis is true, which is exactly what is expected with a 5% significance level. The danger is that the literature becomes littered with the results of Type I errors and that these plausible hypotheses become part of the established folklore of ecology. Editors of journals need to be prepared to publish non-significant results that contradict earlier results. Every concept that has crept into the literature needs to be challenged – it may well be a Type I error, and the status it enjoys may be folklore.
THE SOUTHERN AFRICAN BIRD ATLAS PROJECT
Political effects
Southern Africa has somewhat arbitrarily been defined as Africa south of the Zambezi and Kunene Rivers. At the beginning of the 20th century, before political South Africa came into being in 1910, this area was often referred to as ‘South Africa’ (e.g. Stark & Sclater 1900–1906; remarkably, this usage persisted for decades; see, for example, McLachlan & Liversidge 1957). This definition of southern Africa makes little biogeographical sense, but it is deeply ingrained; it includes Botswana, Lesotho, Namibia, South Africa, Swaziland, Zimbabwe, and Mozambique south of the Zambezi River, six and about a half countries.
The Southern African Bird Atlas Project (Harrison 1987, 1992; Harrison et al. 1997a,b) was the largest biodiversity project ever conducted in Africa (Mbuende 1997). During the period 1980–1992, but mainly 1987–1991, seven million records of bird distribution were collected in southern Africa, but Mozambique was excluded because of the civil war there at the time. The political situation in Mozambique subsequently improved and an atlas of Mozambique south of the Save River was based on fieldwork conducted over the period 1995–1998 (Parker 1999); fieldwork in central Mozambique commenced in 1999 (V. Parker in litt.).
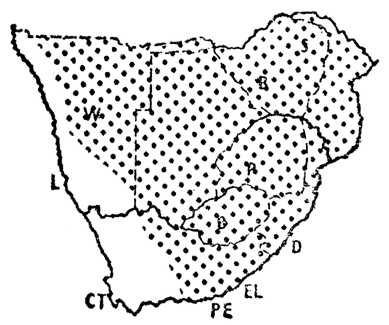
The enormous and bizarre social experiment that was conducted in South Africa finally collapsed in 1994 soon after the end of the data collection period for the atlas. The impact of the land-use policies associated with this period is clearly visible within some of the atlas distribution maps. The historical distribution of the Bateleur Terathopius ecaudatus, as represented by McLachlan & Liversidge (1957) (Fig. 1), is broadly supported by the data of Stark & Sclater (1903) and Boshoff et al. (1983). The atlas distribution (Fig. 2, for details of interpretation see Harrison & Underhill 1997) shows several limits which have no relationship to ecological boundaries: a sharp cut-off along the border between South Africa and Botswana and between Namibia and Botswana; within South Africa Bateleurs are largely confined to the large conservation areas (Kruger National Park, the large reserves in northern KwaZulu-Natal, and the Kalahari Gemsbok National Park); in Namibia, the core of the distribution is in the Etosha National Park, and in Botswana it is in the Okavango Delta; in Zimbabwe it is absent from the north-central plateau area. Outside of conservation areas, Bateleurs persist in areas where the predominant land use is subsistence farming by rural (black) communities; the areas from which they have disappeared are those of extensive (white) ranch farms. In these areas, poisoned bait is traditionally used for jackals and other potential predators of small-stock, goats and sheep; the Bateleur is an efficient scavenger and is therefore frequently first to poisoned bait; as a result the distribution map has been neatly trimmed along the edges of the ranch farming areas (Watson 1986; Simmons 1997). This atlas map is already out of date; within South Africa, and especially in the Northern Cape, the Raptor Conservation Group of the Endangered Wildlife Trust is making progress with initiatives to educate farmers and farm-labourers, and Bateleurs are slowly returning to breed in areas where they have occurred only as vagrants for decades (M.D. Anderson, G. Verdoorn pers. comm.).
Helmeted Guineafowls Numida melagris tell another aspect of the same story (Little 1997; Fig. 3). The atlas distribution map showed them to be frequently recorded on the South African side of the border with Botswana; it is rarer on the Botswanan side and absent from the Transkei – in protein-poor communities they are hunted for food (Little 1997). The ‘Transkei hole’ is a distinct feature of the distributions of many species in the atlas, especially those that nest on the ground (Allan et al. 1997). The Transkei was compelled to support unsustainably high human densities, and was inevitably ecologically degraded. Although political situations can undergo instant transformations, the environment operates to a different time-scale, especially when it is impacted as hard and as long as happened in the Transkei and the other so-called homelands of South Africa, in which 67% of the nation’s population lived on 14% of the land surface.
Variations in texture
An interesting feature of the distribution maps in the southern African bird atlas is the variability in texture. The two species used to illustrate this concept are the introduced House Sparrow and the indigenous Cape Sparrow (Brooke 1997; Dean 1997). The distribution of the House Sparrow shows variable reporting rates; in contrast, the distribution of the Cape Sparrow shows relatively uniform reporting rates (Fig. 4). For species which are totally dependent on a scarce but widely distributed habitat, we would expect the distribution map to look like a random chessboard. A species that is catholic in its choice of habitat is likely to have a far smoother distribution. Erni (1998) devised a method for measuring continuity of distribution in the atlas maps and the results for all species are given in Underhill & Erni (1999). The method measures the differences between reporting rates in adjacent grid cells on the distribution map, taking into account the number of checklists available for each pairwise comparison of reporting rates. The statistic lies between zero and one. The extreme value of one is obtained when there is no continuity of distribution whatsoever, and each grid cell in which a species is observed is isolated from all other observations by at least one grid cell (as happens, for example, with vagrant migrants). The value of zero is obtained when the reporting rate in every grid cell is identical. For most species with a wide distribution, the statistic lies near the lower end of the range (Underhill & Erni 1999). For the House Sparrow, the statistic was 0.18, and for the Cape Sparrow, 0.08 (Underhill & Erni 1999). We believe that this analysis of the texture of distributions in The atlas of southern African birds provides a method to quantify the concept of extent of fragmentation of distribution. The atlas data, effectively on a 25 km grid, are not necessarily fine-scaled enough for this type of analysis. Clearly the grid needs to be species-dependent, and could be as little as 100 m for some species. However, the method can be used on any scale, and may prove a useful way to quantify the concept of fragmentation.
Climatic patterns
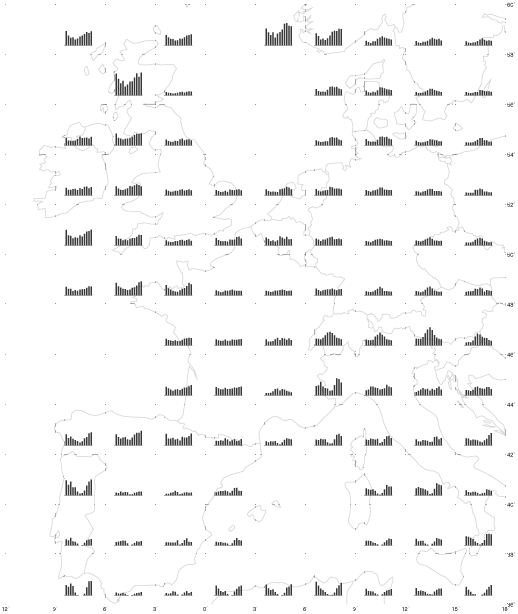
Rainfall across southern Africa is strongly seasonal; except along the extreme southern coast, many areas have no meaningful rain for six or more months of the year (Fig. 5). The rainfall gradient across southern Africa is such that over a distance of 1600 km along latitude 27°S from Kosi Bay, northern KwaZulu-Natal, to Lüderitz, central Namibia, the vegetation ranges from forest to desert. Seasonality of rainfall over a similar-sized region of western Europe and northern Africa is moderate, and a really dry season is either non-existent or short (Fig. 6).
In southern Africa, birds operate in conditions where rainfall is extremely unpredictable, both in timing and in amount (Fig. 7). It is for this reason that southern African ducks have done away with a breeding plumage; on the rare occasions when conditions are suitable, breeding commences immediately.
Over most of the southern African interior, the differences between the means of minimum and maximum daily temperatures in each month are close to 20°C (Fig. 8). At coastal grid cells the moderating influence of the ocean is evident. The striking characteristic of the interior is that, in many places, the mean maximum temperature in midwinter is higher than the mean minimum temperature in summer. Thus, at Windhoek, Namibia, the mean maximum temperature for June is 21°C, and the mean minimum for January is 17°C. Daytime temperatures in midwinter are higher than night-time temperatures in midsummer. Another way of saying this is that on most days of the year, at some time of the day, the temperature is 20°C; in summer this is near the lower end of the daily temperature range, in winter near the upper end. For comparison, in western Europe, the mean range of daily temperatures in each month is about 4–5°C (Fig. 9)
The Western Cape, the region around Cape Town, has a mediterranean climate, with rainfall in winter. On the same latitude, the Eastern Cape has its rainfall in summer. There are many species which are occur in both areas. In the Western Cape, most breed in early spring, as rainfall is tailing off; in the Eastern Cape, these same species mostly breed a month or two later, as the wet season there gets underway (Harrison et al. 1997a,b). There appear to be no detailed studies comparing the cues used by birds to initiate breeding in these two regions, both at the same latitude, having the same photoperiod regimes, but with contrasting rainfall seasons. This represents another research niche in southern Africa that has not yet been exploited.
THE STATISTICS OF MOULT
Moult is a fascinating phenomenon to study, from a statistical perspective. Even restricting attention to the moult of the primary wing feathers, and assuming that this moult proceeds uninterrupted from beginning to end, there is a rich statistical theory to be developed (Underhill & Zucchini 1988; Underhill et al. 1990; Brandão 1998). From a phenology perspective, the two key primary moult parameters that need to be estimated are the mean starting date of moult and its duration.
Statisticians tend to build up models from the simplest to those that are more complex. It is a valuable insight to realise that the world’s leading modellers regard their efforts with a large measure of cynicism: ‘All models are wrong; some, though, are better than others . . . we must realize that eternal truth is not within our grasp’(McCullagh & Nelder 1983), ‘Even the most general mathematical model is a plaything relative to the complexities of an animal population’ (Cormack 1968), and ‘Models are . . . relevant tools to explore and, hopefully, answer specific questions about reality’ (Lebreton et al. 1992). Lesser modellers tend to have a stronger faith in their models. It is helpful to keep in mind the dictionary definition of ‘model’, ‘a small version of the real thing’. Although the context of the definition is non-mathematical, it reminds us that ‘scale’ is an important element of model construction both with mathematical and physical models.
For the analysis of moult, the simple model starts by assuming that the duration parameters are the same for all birds in a population (Underhill & Zucchini 1988). What makes the ‘moult problem’ fascinating for a statistician is that, in a non-captive population, it is essentially impossible to observe the actual dates on which primary moult starts and finishes on individual birds. What is observed in the field is birds ‘not yet moulted’, ‘in moult’ or ‘completed moult’. If the birds are in moult, there is an almost universal method for recording ‘moult scores’, which measures how advanced moult is (Ginn & Melville 1983). An estimate of the rate of moult is then needed to estimate the starting and completion dates for individual birds.
Applying the method of maximum likelihood to moult observations turns out to be relatively complex mathematically; the statistical interest arises because the likelihood function is a mixture of both continuous and discrete statistical distribution functions, a situation that occurs rarely in applications (Underhill & Zucchini 1988; Underhill et al. 1990). These first-generation moult models have been extended by Brandão (1998), and enable comparisons between years, localities and genders. The third generation of moult models, which still need to be developed, will permit the inclusion of continuous explanatory variables, such as latitude, temperature, rainfall and body condition measures.
An important practical lesson to be learnt from these models is that the protocol used by most moult schemes to collect data, which is to collect moult records only from those birds which are actively in moult, is weak. Moult records are also needed from birds which have ‘not yet moulted’ and from those that have ‘completed moult’. There is information in those records, and the Underhill–Zucchini model extracts it. How this works is easy to see intuitively. If large samples of birds are trapped on a regular basis, the best informal estimate of the mean starting date of moult in a population is the date on which almost exactly half the birds are in moult, and similarly the mean completion date is the date on which half the birds trapped have completed moult.
If birds can be sampled throughout their moult period, moult recording can be reduced to just three categories of observations: ‘not yet moulted’, ‘completed moult’, and ‘in moult’, ignoring the detailed moult scores for each feather (Underhill & Zucchini 1988). With only the numbers of birds in each of these three categories on each date, we could estimate the parameters of moult almost as well as if we had the actual moult scores. Newton & Rothery (in press) have reanalysed the data in Newton’s (1966) seminal paper on the moult of the Bullfinch Pyrrula pyrrula; their conclusion is that the three-category approach is the preferred one. This result, being based on one dataset, needs to be confirmed by further analyses.
THE ORNITHOLOGY OF MOULT
The way in which moult is fitted into the annual cycle seems to be a somewhat neglected area which is both of interest and of importance. Jenni & Winkler (1994) stated: ‘Ecological and behavioural explanations of the timing, rate and extent of moult have lagged behind corresponding studies of reproduction.’ Moult is of interest to ornithologists in a pathological way, because feather moult is uniquely ornithological. Moult is physiologically important because up to a quarter of the lean dry mass of a bird is plumage, consisting mainly of proteins, and in most species, the entire plumage is replaced annually, with much variation in the strategies for doing this. Thus moult makes major demands on birds, and the variety of ways that this demand is resolved is as diverse and as rich and as complex a field of study as any other in ecophysiology.
Part of the reason for this neglect of the study of moult as a component of the annual cycle is probably due to a lack of adequate quantitative tools to make comparisons between localities and species. But this barrier is, at least in part, removed; quantitative comparative research on the timing and duration of moult can be intensified, and the development of third generation moult models will enable explanatory variables to be included in models and facilitate the testing of ecological hypotheses in relation to moult.
It is well known that clutch sizes in the tropics and southern hemisphere are smaller than in the temperate regions. For example, the Stonechat Saxicola torquata has the widest north–south breeding range of any bird species; the northernmost breeding record is at about 70°N in the forest tundra of Siberia, and the southernmost at Cape Agulhas, at 35°S, the southern limit of Africa. Siberian Stonechats have a modal clutch size of six eggs; in southern Africa, it is three eggs (Rogacheva 1992; Maclean 1993).
It is also becoming accepted that annual survival probabilities in the tropics are larger than in the temperate regions. The earliest models for estimating survival rates introduced drastic simplifying assumptions which were unrealistic in practice; the turning point came with the publication of Seber’s (1973) review. Gradually, the early models were extended, and the assumptions have been replaced by increasingly more realistic ones. We now have a useful set of methods, and associated software, that provide reliable answers (e.g. Pradel & Lebreton 1991). This is in no small measure due to the efforts of EURING, the European Union of Ringing Schemes, which has organized technical workshops since 1981 at approximately three-year intervals (North 1987, 1990; Lebreton & North 1993; North & Nichols 1995). These workshops have brought together the statisticians developing the theory and the practitioners who have to apply it. This interaction has been singularly productive, and represents an excellent modus operandi for moving forward in other areas – such as moult – that generate data for which existing statistical theory provides weak methods of analysis.
As an aside, the world’s oldest passerine was ringed 90 km from the conference centre in Durban. A Chorister Robin Cossypha dichroa, six months old when ringed in Kilgobbin Forest on 27 May 1956 and retrapped on 14 April 1981, was in at least its 26th year; there is also a record from the same site of a Chorister Robin in its 17th year (Oatley 1981, 1982; Oatley & Arnott 1998). What makes these longevity records even more remarkable is that the total number of Chorister Robins ever ringed is 46 (Oatley & Underhill 1993).
If clutch size and survival rates differ between the northern temperate regions and the tropics and southern hemisphere, how do moult duration and timing vary? In the northern temperate region, for residents and some migrants, the pattern for many species is to fit moult into the period between breeding and the onset of severe weather – periods with subzero temperatures, frequently with snow on the ground – or the start of migration (e.g. Jenni & Winkler 1994). This period is frequently one to three months, dependent on species and latitude (Kjellen 1994).
Given that the constraint of the onset of severe weather is removed for tropical species, the expectation is that moult would be spread over a longer period. This is certainly true for some species, but there seem to be many exceptions. Hanmer (1988) showed that moult duration of two Afrotropical Acrocephalus warblers in Malawi is about 60 days, much the same duration as Acrocephalus warblers in Europe (Ginn & Melville 1983).
There are many opportunities for the study of moult in southern Africa. For example, comparisons can be made between the timing and duration of moult for species introduced a century ago, both with closely related but indigenous species, and with conspecifics of the population from which they were drawn. The primary moult of the indigenous Cape Sparrow Passer melanurus takes 125 days in the Western Cape; a century after its introduction, the introduced House Sparrow P. domesticus takes 45 days less, completing primary moult in 80 days (LGU unpubl. data). A duration of 80 days is similar to values obtained in Europe, but the methods used differ (Ginn & Melville 1983). In addition, the House Sparrows introduced into southern Africa were mostly the Indian subspecies indicus (Liversidge 1985; Brooke 1997); in India moult proceeds on a stop-start fashion between breeding attempts (Naik & Mistry 1980; Mathew & Naik 1986), a pattern that as yet defies attempts to put it into any realistic mathematical modelling context.
For the European Starling Sturnus vulgaris, introduced in 1898 to the Western Cape from Britain (Liversidge 1985; Craig 1997), two studies showed the duration of moult of introduced birds in southern Africa to be 106 days, whereas the duration in Britain is about 25% shorter, 80 days (Ginn & Melville 1983; Cooper & Underhill 1991; LGU unpubl. data). However, the methods used differ, and no conclusions can safely be drawn. Cooper & Underhill (1991) noted ‘It is surprising that for a bird as well studied as the European Starling, no definitive study of the moult of non-captive individuals has yet been published in any part of its range, either natural or introduced.’
There are few detailed studies of moult timing and duration in southern Africa, or anywhere on the continent south of the northern tropic (Craig 1983; Jenni & Winkler 1994). In addition, the statistical methods employed in all these studies are diverse, and the results are frequently not readily comparable.
Jenni & Winkler (1994) conceded that moult strategies of passerines in north temperate western Europe did not show a lot of variation; but there was still sufficient variation to fill a substantial book. If they had worked on moult in African, rather than European passerines, the equivalent book would need to be several volumes long, for two reasons – there are far more species, and there is a bewildering array of variations on the moult theme. Currently, there is probably sufficient information to fill only half a volume (Craig 1983). There are about 1200 breeding passerines in subsaharan Africa, plus some 84 passerines that breed in the Palearctic and migrate south of the Sahara Desert (Maclean 1990; Jenni & Winkler 1994). Of the migrant species Jenni & Winkler (1994) stated: ‘the timing of moult of trans-Saharan migrants is still poorly understood.’
One species for which primary moult is being coherently analysed on a global scale is the Grey Plover, with preliminary results given by Serra (in press), who is undertaking identical analyses on moult data gathered by ringers in many parts of the nonbreeding range. Although the number of points is small, Serra (in press) found that starting date of moult is linear with distance from the breeding grounds (rather than with latitude) and that duration of moult is about 90 days at three northern sites, and 130 days at three southern sites. At each of the three northern sites, there are c. 90 days available for moult before winter conditions become sufficiently harsh that birds increase their fat loads as an insurance against freezing conditions in which they cannot feed. Grey Plovers which have not completed moult at this time, suspend moult, and resume in the northern spring before migration to the breeding grounds (Branson & Minton 1976).
In areas farther south, where freezing conditions never occur, and Grey Plovers do not show increased fat loads in January, moult duration is about 130 days. This suggests 130 days might be the physiologically optimal moult duration in circumstances in which there are no climatic restraints. The limit of severe weather conditions in the northern winter is likely to be at about 20°N. Serra’s (in press) prediction is that moult durations of between 90 and 130 days will occur at localities along the coast of Iberia and Morocco.
From a moult perspective, a good moult migration strategy for Grey Plovers would be to go just far enough south to undertake standard speed moult. For Grey Plovers this would be in the region between about 20°N and the equator. On the East Atlantic Flyway, it might well be that the best place for a wader to migrate to is the major wetlands of Mauritania and Guinea-Bissau in western Africa. Wetlands farther north are less attractive because of the risks associated with hard weather (Davidson 1981), and wetlands farther south are less attractive because of risks associated with longer migration distances (Summers et al. 1995).
The pattern of increasing moult durations southwards appears to be the general rule for waders, apart from one exception; the duration of moult of the Knot Calidris canutus is 85 days in in the Waddensee, the Netherlands, and at Langebaan Lagoon, South Africa (Boere 1976; Ginn & Melville 1983; LGU & R.W. Summers unpubl. data).
Jenni & Winkler (1994) hoped that their book, and I hope that this plenary, ‘will provide a stimulus’ for moult studies. Much remains to be done in this field.
ACKNOWLEDGEMENTS
Support from the Foundation for Research Development and the University of Cape Town Research Committee is acknowledged. Major sponsors of the Avian Demography Unit include the South African Department of Environmental Affairs and Tourism, BirdLife South Africa, Tony and Lisette Lewis Foundation South Africa, Mazda Wildlife Fund, World Wide Fund for Nature: South Africa, Total South Africa, BirdLife International and Royal Society for the Protection of Birds. Permission from BirdLife South Africa to reproduce maps from the atlas of southern African birds is acknowledged. James Harrison and René Navarro of the Avian Demography Unit helped with the preparation of graphics.
REFERENCES
Allan, D.G., Harrison, J.A., Herremans, M., Navarro, R. & Underhill, L.G. 1997. Southern African geography: its implications for birds. In: Harrison, J.A., Allan, D.G., Underhill, L.G., Herremans, M., Tree, A.J., Parker, V. & Brown, C.J. (eds) The atlas of southern African birds. Vol. 1: Non-Passerines. Johannesburg: BirdLife South Africa: lxv–ci.
Boere, G.C. 1976. The significance of the Dutch Waddenzee in the annual life cycle of arctic, subarctic and boreal waders. Part 1: The function as a moulting area. Ardea 64: 210–291.
Boshoff, A.F., Vernon, C.J. & Brooke, R.K. 1983. Historical atlas of the diurnal raptors of the Cape Province (Aves: Falconiformes). Ann. Cape Prov. Mus. (Nat. Hist.) 14: 173–297.
Brandão, A. 1998. A comparative study of stochastic models in biology. Unpubl Ph.D. thesis, University of Cape Town, Cape Town.
Branson, N.J.B.A. & Minton, C.D.T. 1976. Moult, measurements and migrations of the Grey Plover. Bird Study 23: 257–266.
Brooke, R.K. 1997. House Sparrow Passer domesticus. In: Harrison, J.A., Allan, D.G., Underhill, L.G., Herremans, M., Tree, A.J., Parker, V. & Brown, C.J. (eds) The atlas of southern African birds. Vol. 2: Passerines. Johannesburg: BirdLife South Africa: 536–537.
Cooper, J. & Underhill, L.G. 1991. Breeding, mass and primary moult of European Starlings Sturnus vulgaris at Dassen Island, South Africa. Ostrich 62: 1–7.
Cormack, R.M. 1968. The statistics of mark-recapture models. Oceanogr. Mar. Biol. Ann. Rev. 6: 455–506.
Craig, A.J.F.K. 1983. Moult in southern African passerine birds: a review. Ostrich 54: 220–237.
Craig, A.J.F.K. 1997. European Starling Sturnus vulgaris. In: Harrison, J.A., Allan, D.G., Underhill, L.G., Herremans, M., Tree, A.J., Parker, V. & Brown, C.J. (eds) The atlas of southern African birds. Vol. 2: Passerines. Johannesburg: BirdLife South Africa: 452–453.
Davidson, N.C. 1981. Survival of shorebirds (Charadrii) during severe weather: the role of nutritional reserves. In: Williams, N.V. & Wolff, W.J. (eds) Feeding and survival strategies of estuarine organisms. New York: Plenum Press: 231–249.
Dean, W.R.J. 1997. Cape Sparrow Passer melanurus. In: Harrison, J.A., Allan, D.G., Underhill, L.G., Herremans, M., Tree, A.J., Parker, V. & Brown, C.J. (eds) The atlas of southern African birds. Vol. 2: Passerines. Johannesburg: BirdLife South Africa: 540–541.
Erni, B. 1998. Analysis of distribution maps from bird atlas data: dissimilarities between species, continuity within ranges and smoothing of distribution maps. Unpubl. MSc thesis, University of Cape Town.
Ginn, H.B. & Melville, D.S. 1983. Moult in birds. BTO Guide 19. Tring: British Trust for Ornithology.
Hanmer, D.B. 1988. Moult in the Cape Reed Warbler and African Marsh Warbler Acrocephalus gracilrostris and A. baeticatus. Proc. Pan-Afr. Ornithol. Congr. 6: 331–337.
Harrison, J.A. 1987. The Southern African Bird Atlas Project. S. Afr. J. Sci. 83: 400–401.
Harrison, J.A. 1992. The Southern African Bird Atlas Project databank – five years of growth. S. Afr. J. Sci. 88: 410–413.
Harrison, J.A. & Underhill, L.G. 1997. Introduction and methods. In: Harrison, J.A., Allan, D.G., Underhill, L.G., Herremans, M., Tree, A.J., Parker, V. & Brown, C.J. (eds) The atlas of southern African birds. Vol. 1: Non-Passerines. Johannesburg: BirdLife South Africa: xliii–lxiv.
Harrison, J.A., Allan, D.G., Underhill, L.G., Herremans, M., Tree, A.J., Parker, V. & Brown, C.J. (eds) 1997a. The atlas of southern African birds. Vol. 1: Non-Passerines. Johannesburg: BirdLife South Africa.
Harrison, J.A., Allan, D.G., Underhill, L.G., Herremans, M., Tree, A.J., Parker, V. & Brown, C.J. (eds) 1997b. The atlas of southern African birds. Vol. 2: Passerines. Johannesburg: BirdLife South Africa.
Jenni, L. & Winkler, R. 1994. Moult and ageing of European passerines. London: Academic Press.
Kjellen, N. 1994. Moult in relation to migration in birds – a review. Ornis Svecica 4: 1–24.
Lebreton, J.-D., Burnham, K.P., Clobert, J. & Anderson, D.R. 1992. Modeling survival and testing biological hypotheses using marked animals: A unified approach with case studies. Ecol. Monogr. 62: 67–118.
Lebreton, J.-D. & North, P.M. (eds) 1992. Marked individuals in the study of bird populations. Basel: Birkhäuser Verlag.
Little, R.M. 1997. Helmeted Guineafowl Numida meleagris. In: Harrison, J.A., Allan, D.G., Underhill, L.G., Herremans, M., Tree, A.J., Parker, V. & Brown, C.J. (eds) The atlas of southern African birds. Vol. 1: Non-Passerines. Johannesburg: BirdLife South Africa: 308–309.
Liversidge, R. 1985. Alien bird species introduced into southern Africa. In: Bunning, L.J. (ed.) Proceedings of the Birds and Man Symposium. Johannesburg: Witwatersrand Bird Club: 31–44.
Maclean, G.L. 1990. Ornithology for Africa. Pietermaritzburg: University of Natal Press.
Maclean, G.L. 1993. Roberts’ birds of southern Africa. Sixth ed. Cape Town: John Voelcker Bird Book Fund.
Mathew, K.L. & Naik, R.M. 1986. Interrelationship between moulting and breeding in a typical population of House Sparrows Passer domesticus. Ibis 128: 260–265.
Mbuende, K. 1997. Speech at atlas launch. Africa – Birds & Birding 2(5): 70.
McCullagh, P. & Nelder, J.A. 1983. Generalized linear models. London: Chapman & Hall.
McLachlan, G.R. & Liversidge, R. 1957. Roberts’ birds of South Africa. Cape Town: John Voelcker Bird Book Fund.
Müller, M.J. 1982. Selected climate data for a global set of standard stations for vegetation science. The Hague: Junk.
Naik, R.M. & Mistry, L. 1980. Breeding season in a tropical population of the House Sparrow. J. Bombay Nat. Hist. Soc. 75 Suppl.: 1118–1142.
Nelder, J.A. 1999. From statistics to statistical science. J. Roy. Statist. Soc. D. 48, in press.
Newton, I. 1966. The moult of the Bullfinch Pyrrhula pyrrhula. Ibis 108: 41–87.
Newton, I. & Rothery, P. in press. Timing and duration of moult in the Bullfinch: an appraisal of different analytical procedures. Ibis.
North, P.M. (ed.) 1987. Ringing recovery analytic methods. Acta Ornithol. 23: 1–175.
North, P.M. (ed.) 1990. The statistical investigation of avian population dynamics using data from ringing recoveries and live recaptures of marked birds. The Ring 13: 1–314.
North, P.M. & Nichols, J.D. (eds) 1995. Special issue: statistics and ornithology. J. Appl. Statist. 22: 553–1081.
Oatley, T.B. 1981. The oldest passerine? Safring News 10: 27–28.
Oatley, T.B. 1982. The oldest passerine. Safring News 11: 21.
Oatley, T.B. & Arnott, G. 1998. Robins of Africa. Randburg: Acorn Books and Halfway House: Russel Friedman.
Oatley, T.B. & Underhill, L.G. 1993. Merging recoveries and recaptures to estimate survival probabilities. In: Lebreton, J.-D. & North, P.M. (eds) Marked individuals in the study of bird population. Basel: Birkhäuser Verlag: 77–90.
Parker, V. 1999. The atlas of the birds of Sul do Save, southern Mozambique. Cape Town and Johannesburg: Avian Demography Unit and Endangered Wildlife Trust.
Pradel, R. & Lebreton, J.-D. 1991. Users manual for program SURGE. Montpellier: CEPE/CNRS.
Rogacheva, E.V. 1992. The birds of central Siberia. Husum: Husum Druck- und Verlagsgesellschaft.
Seber, G.A.F. 1973. The estimation of animal abundance and related parameters. London: Griffin.
Serra, L. in press. The adaptation of primary moult to migration and wintering in the Grey Plover (Pluvialis squatarola). Biol. Cons. Fauna.
Simmons, R.E.L. 1997. Bateleur Terathopius ecaudatus. In: Harrison, J.A., Allan, D.G., Underhill, L.G., Herremans, M., Tree, A.J., Parker, V. & Brown, C.J. (eds) The atlas of southern African birds. Vol. 1: Non-Passerines. Johannesburg: BirdLife South Africa: 202–203.
Stark, A.C. & Sclater, W.L. 1900–1906. The fauna of South Africa: the birds of South Africa. Vols 1–4. London: Porter.
Summers, R.W. & Underhill, L.G. 1991. The relationship between body size and time of breeding in Icelandic Redshanks Tringa totanus. Ibis 133: 134–139.
Summers, R.W., Underhill, L.G., Nicoll, M., Rae, R. & Piersma, T. 1992. Seasonal, size- and age-related patterns in body-mass and composition of Purple Sandpipers Calidris maritima in Britain. Ibis 134: 346–354.
Underhill, L.G. 1973. Further distributions of multivariate quadratic forms. Unpubl. PhD thesis, University of Cape Town, Cape Town.
Underhill, L.G. & Erni, B. 1999. Fragmentation and continuity of the distributions of southern African bird species. ADU Research Report 31.
Underhill, L.G., Oatley, T.B. & Harrison, J.A. 1991. The role of large-scale data collection projects in the study of southern African birds. Ostrich 62: 124–148.
Underhill, L.G. & Zucchini, W. 1988. A model for avian primary moult. Ibis 130: 358–372.
Underhill, L.G., Zucchini, W. & Summers, R.W. 1990. A model for avian primary moult – data types based on migration strategies, illustrated by an example using the Redshank Tringa totanus. Ibis 132: 118–123.
Watson, R.T. 1986. The ecology, biology and population dynamics of the Bateleur Eagle Terathopius ecaudatus. Unpubl. Ph.D. thesis, University of the Witwatersrand, Johannesburg.
Zucchini, W. & Adamson, J. 1984. The occurrence and severity of droughts in South Africa. Pretoria: Water Research Commission.
Fig. 1. The historical distribution of the Bateleur, as shown by McLachlan & Liversidge (1957).

Fig. 2. The distribution of the Bateleur for the period 1980–1992 (Simmons 1997).
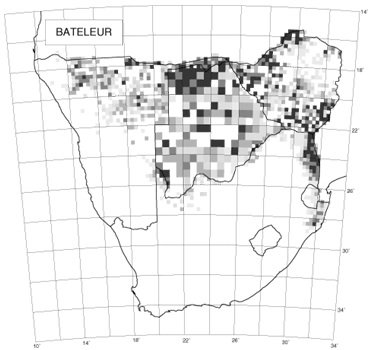
Fig. 3. The distribution of the Helmeted Guineafowl for the period 1980–1992 (Little 1997).
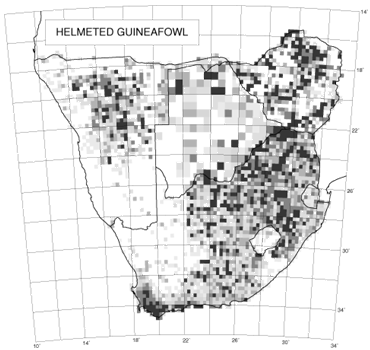
Fig. 4. The distributions of the Cape Sparrow (left) and House Sparrow (right) (Brooke 1997; Dean 1997).
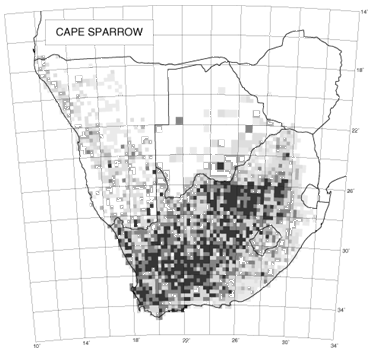
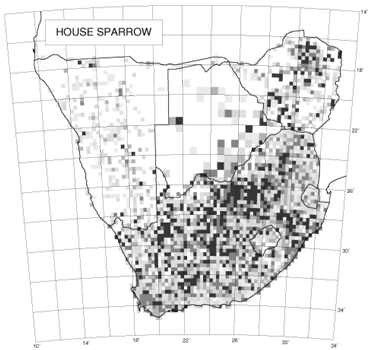
Fig. 5. Histograms of mean monthly rainfall (mm) for one rainfall station per 2 x 2 degree grid cell in southern Africa. Data sources listed in Allan et al. (1997).
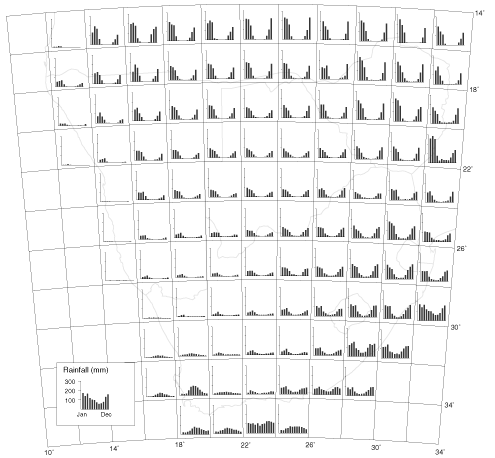
Fig. 6. Histograms of mean monthly rainfall (mm) for one rainfall station per 2 x 3 degree grid cell in western Europe and northern Africa. Data obtained from Müller (1982).
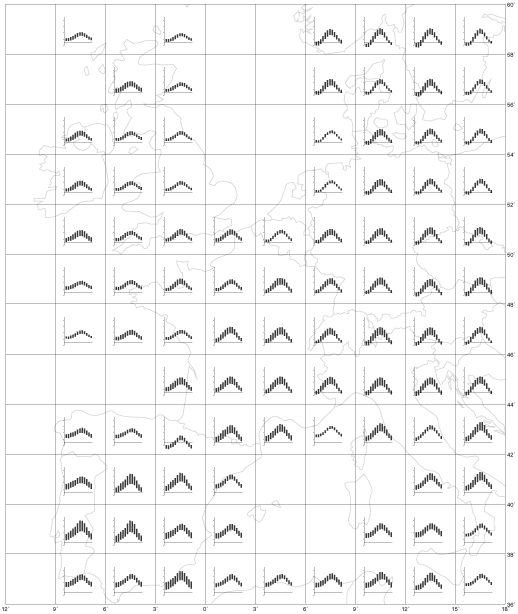
Fig. 7. Contours of coefficients of rainfall in South Africa (Zucchini & Adamson 1984).
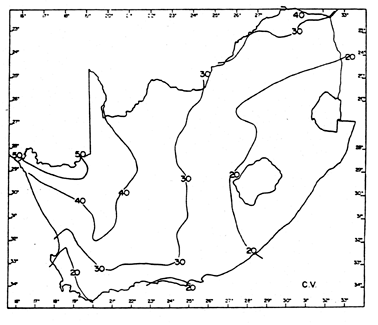
Fig. 8. Histograms of monthly mean minimum and maximum temperatures (°C) for one temperature-recording station per 2 x 2 degree grid cell in southern Africa. Data sources listed in Allan et al. (1997).
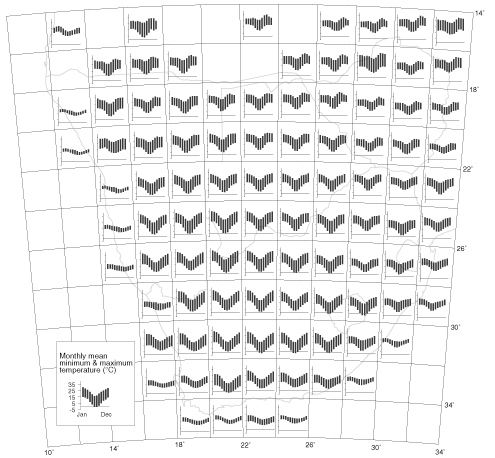
Fig. 9. Histograms of monthly mean minimum and maximum temperatures (°C) for one temperature-recording station per 2 x 3 degree grid cell in western Europe and northern Africa. Data obtained from Müller (1982).
